
How to Fix Core Web Vitals Issues: A Diagnose-First Guide for LCP, INP and CLS
To fix Core Web Vitals issues, start by finding out which metric is failing, on which device, and for which pages, using real-user field data. Then identify the specific cause, make one targeted change, and confirm the result in field data again. Skipping the diagnosis risks spending time on changes that don’t touch the real bottleneck. Google notes, for example, that speeding up one part of LCP can simply shift the time to another part.
This guide follows that order. First you’ll learn what counts as a failing score and how to read the reports. Then you’ll work through a symptom-by-symptom diagnosis, with fixes for LCP, INP and CLS, followed by WordPress, ecommerce and developer notes. The guide ends with a way to verify the fix. It is written for site owners, WordPress users and SEO practitioners, and no step assumes you can code unless a section is marked as developer-level.
One expectation to set now: passing Core Web Vitals is worth doing because it makes your site better for visitors. It does not guarantee higher rankings, more traffic, or citations in AI-generated answers.
How to read this guide: statements that link to Google or Chrome documentation are documented. Steps without a link, and every “Risks” line, are editorial recommendations based on how these changes commonly behave. Test them on your own site rather than treating them as rules.
What counts as a Core Web Vitals issue
The three metrics and their thresholds
Core Web Vitals are three field metrics: one for loading, one for responsiveness and one for visual stability. Google’s guidance is to judge them at the 75th percentile of page loads, segmented across mobile and desktop. In practice, that means at least 75% of visits need a good experience on that device type.
| Metric | What it measures | Good | Needs improvement | Poor |
|---|---|---|---|---|
| Largest Contentful Paint (LCP) | How quickly the largest image or text block in the viewport appears | ≤ 2.5 s | 2.5–4.0 s | > 4.0 s |
| Interaction to Next Paint (INP) | How quickly the page shows a visual response after clicks, taps and key presses | ≤ 200 ms | 200–500 ms | > 500 ms |
| Cumulative Layout Shift (CLS) | How much visible content unexpectedly moves | ≤ 0.1 | 0.1–0.25 | > 0.25 |
A page passes the Core Web Vitals assessment only when it meets the “good” target for all three metrics at the 75th percentile. One poor metric is enough to fail.
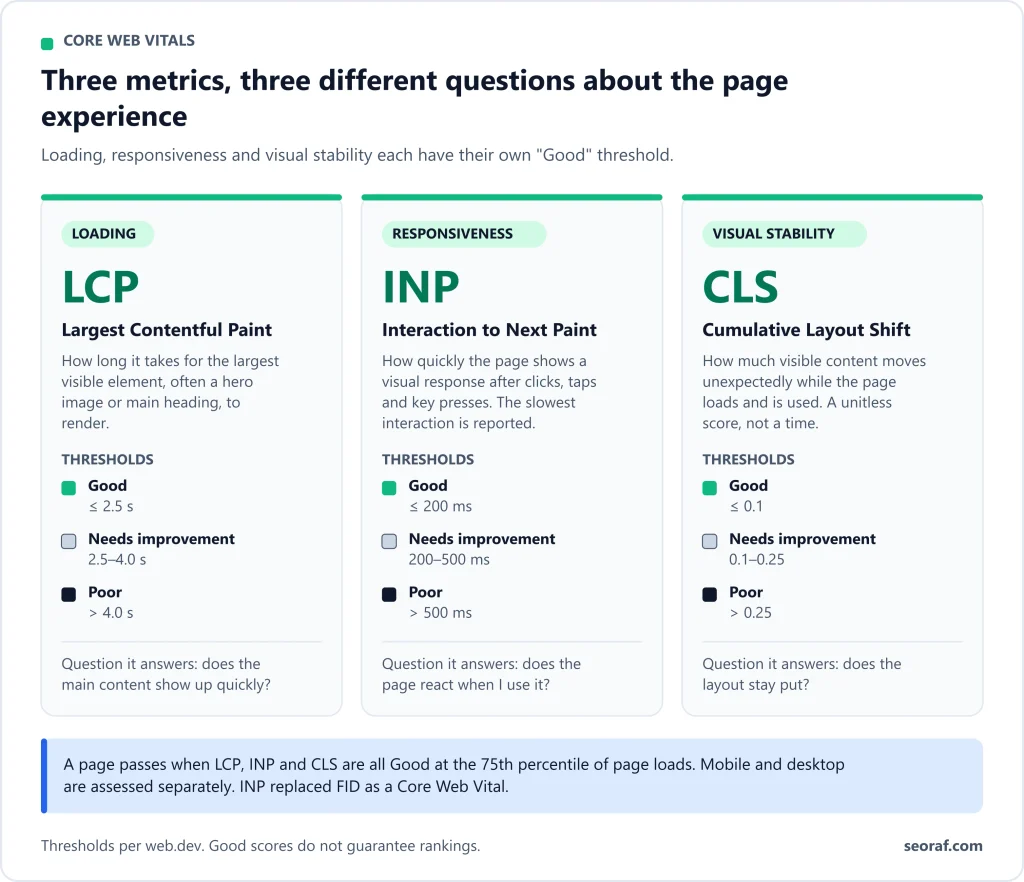
Sources: Web Vitals, Interaction to Next Paint, Optimize LCP, Optimize CLS.
Do Core Web Vitals affect rankings?
Google’s documentation says that Core Web Vitals are used by its ranking systems, and that it recommends achieving good scores. It also says three things that matter just as much:
- There is no single “page experience signal”.
- Good scores in Search Console or third-party tools don’t guarantee top rankings.
- Google Search will still show the most relevant content even when the page experience is poor. Where many helpful results exist, a great page experience can contribute to success.
Google also notes that chasing a perfect score purely for SEO may not be the best use of your time.
So treat these metrics as one part of a good user experience, and don’t expect a pass to move your rankings on its own. Sources: Understanding page experience in Google Search results, Understanding Core Web Vitals and Google Search results.
FID is gone: INP is the responsiveness metric
If a guide still lists “LCP, FID and CLS”, it is out of date. Interaction to Next Paint replaced First Input Delay as a stable Core Web Vital in 2024, and the Chrome UX Report (CrUX) dropped FID in its August 2024 release. FID only measured the delay of the first interaction. INP looks at the responsiveness of interactions throughout the visit. Sources: Web Vitals, Chrome UX Report release notes.
If you want the fundamentals first, see our Technical SEO basics guide.
Diagnose first: a five-step workflow
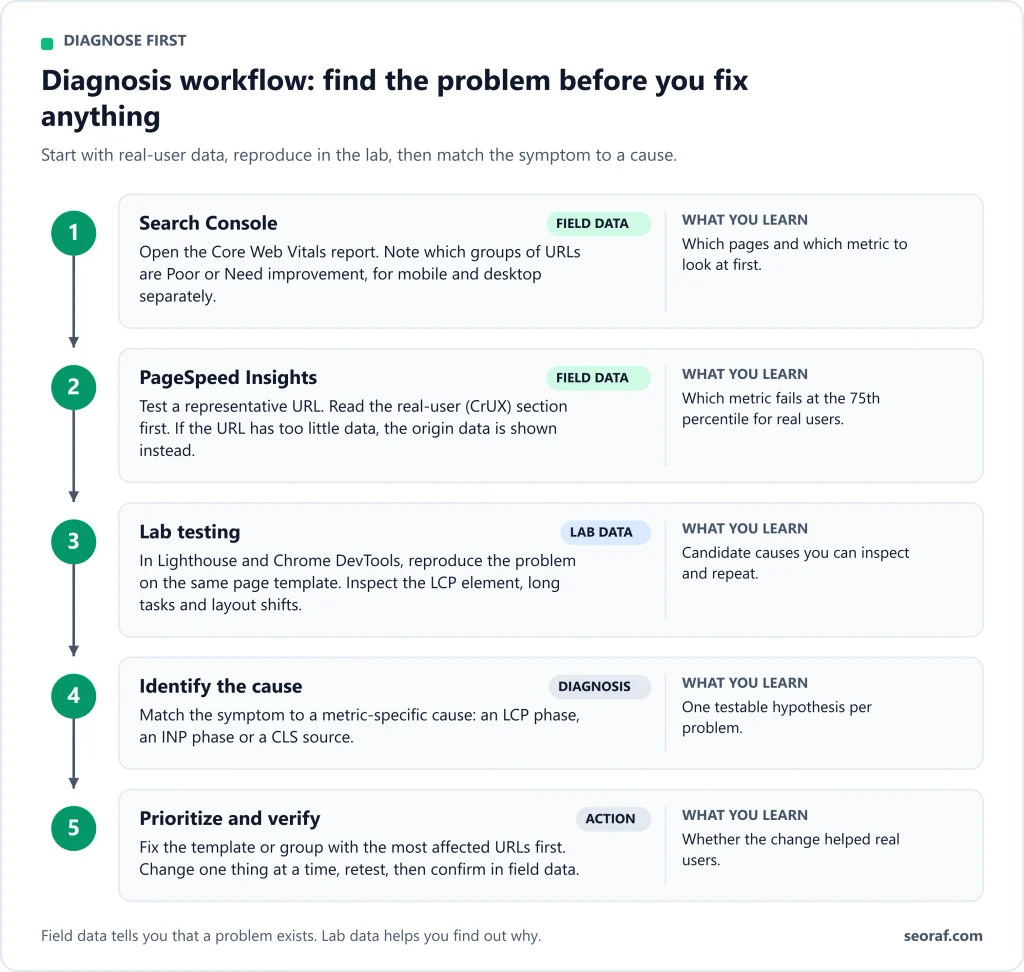
Step 1: Find the failing pages in Search Console
Open the Core Web Vitals report in Google Search Console. Check mobile and desktop separately. Google’s guidance is to assess the two as separate segments, and PageSpeed Insights reports them separately, so a site can pass on one and fail on the other. Check how Search Console presents the two for your property. Note three things:
- Which device type fails.
- Which metric fails (LCP, INP or CLS).
- Which groups of URLs are affected.
Search Console’s report is powered by CrUX field data, which comes from real Chrome users. Because that data comes from real visits, pages without enough traffic may have no data. For the exact grouping rules, minimum data requirements and how fix validation works, see the Search Console Core Web Vitals report documentation.
Step 2: Confirm in PageSpeed Insights field data
Run the affected URL through PageSpeed Insights. It has two very different sections:
- “Discover what your real users are experiencing” is field data from CrUX.
- “Diagnose performance issues” is a lab test run by Lighthouse.
Always read the real-user section first. Check these things:
- Mobile versus desktop. Use the toggle.
- URL versus origin. PageSpeed Insights shows up to four CrUX datasets: mobile or desktop, for this URL or for the whole origin. If a page lacks enough traffic for its own data, the tool falls back to origin-level data. A failing origin score may come from different pages than the one you tested.
- Supporting metrics. First Contentful Paint (FCP) and Time to First Byte (TTFB) don’t count toward the pass, but they point to causes for LCP. A big gap between TTFB and FCP suggests render-blocking files. A big gap between FCP and LCP suggests the main content isn’t discoverable early or is being held up by other work.
Source: Optimize Largest Contentful Paint.
Step 3: Reproduce the problem in the lab, and know the limits
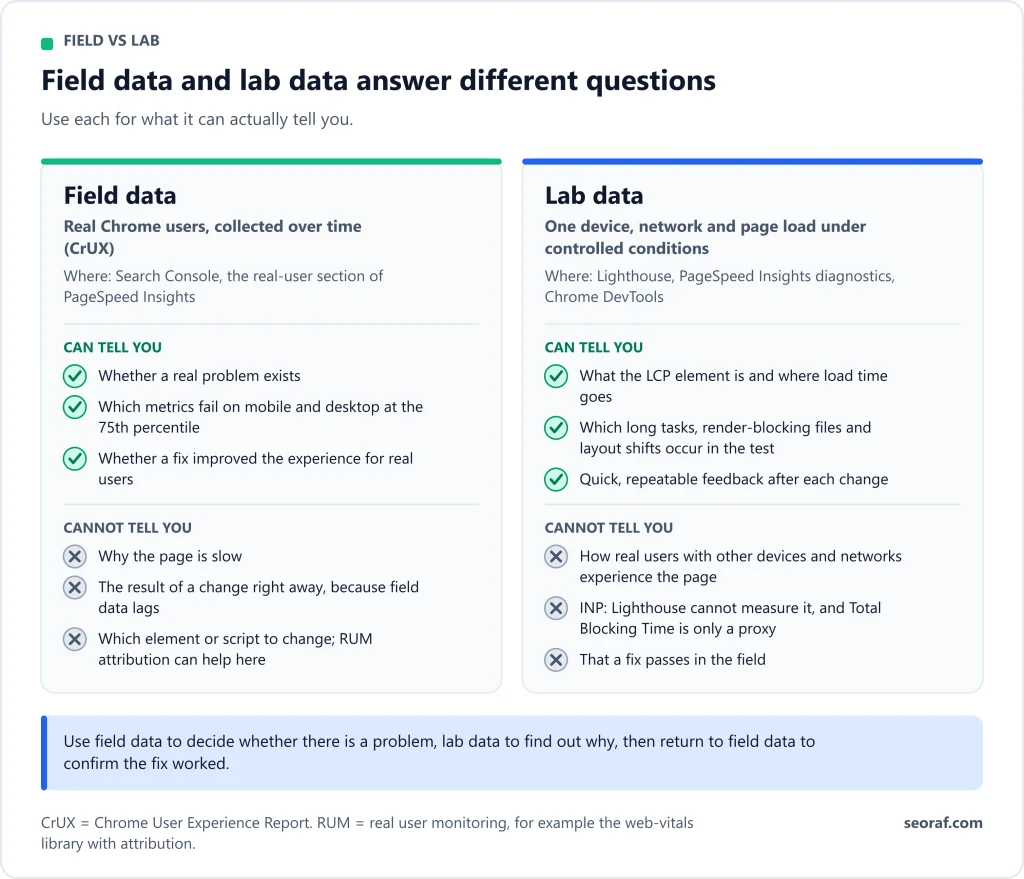
Lab tools like Lighthouse and Chrome DevTools help you find causes, but they test one device, one network and one load. They differ from field data in ways that matter:
- Lighthouse cannot measure INP, because it doesn’t click or type. Total Blocking Time (TBT) is a lab proxy, and improving it may improve INP, but it isn’t a substitute.
- CLS can be higher in the field. Lab tools usually measure only the initial load, while CrUX measures CLS across the whole visit. A gap between the two in PageSpeed Insights often points to post-load shifts, such as lazy-loaded content appearing as someone scrolls.
- LCP can differ because real users have different devices, networks and cache states, and home pages are often loaded “cold”.
When lab and field disagree, Google says field data is more likely to reflect your users’ experience. Use the lab to explain a problem the field data has already shown, and don’t use a good lab score as proof that the problem is gone.
DevTools helps here. Its Performance panel can show your local metrics alongside the page’s CrUX data, with LCP breakdowns and a layout-shift track. Sources: Web Vitals, Optimize LCP, Optimize CLS, INP.
Step 4: Pin down the cause
CrUX can tell you that a page has a problem, but not why. For each metric, identify the specific culprit:
- LCP: which element is the LCP element, and which of its four time slices is longest (explained below).
- INP: which interaction is slow, and whether the delay is before, during or after the event handlers run.
- CLS: which element moves, and whether the shift happens during load or after.
If CrUX and the lab can’t pin it down, Google recommends collecting your own real-user data with the open-source web-vitals library, which includes attribution data. Setting that up usually takes a developer. Steps 1 to 3 need no coding. Source: Web Vitals.
Step 5: Prioritize
Fix the failing metric on the failing device first. If mobile fails LCP and desktop passes, a desktop-focused optimization won’t help. If several metrics fail, start with the one with the clearest cause. Make one change at a time so you can tell what worked, and keep a way to roll it back.
If you have no field data
Low-traffic pages may have no URL-level data, and pages where nobody clicks, taps or types return no INP value at all. In that case:
- use origin-level data as a rough guide;
- test in the lab, including DevTools with throttling;
- consider your own real-user monitoring if the page matters.
Be honest in your own reporting that lab-only conclusions are provisional.
For a wider audit that includes this step, see our advanced SEO audit checklist.
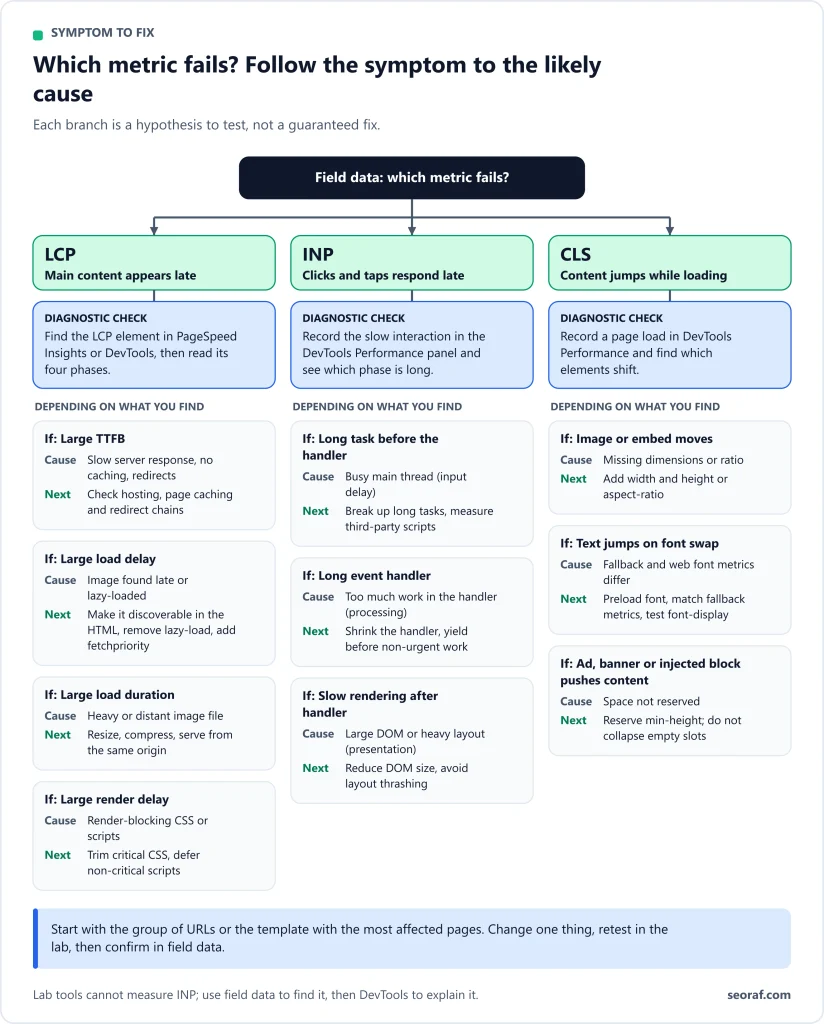
Symptom-to-fix decision table
Use this table to jump to the right fix. Every row is explained in the sections that follow.
| Symptom | Diagnostic check | Likely cause | Corrective action | Verify |
|---|---|---|---|---|
| LCP fails and TTFB is high | PageSpeed Insights supporting metrics; DevTools network waterfall | Slow server response, redirects, uncached pages | Cut redirects; serve cached pages from a CDN or page cache | Field TTFB and LCP improve |
| LCP image starts loading late | View source: is the image in the HTML? Network waterfall | Image added by JavaScript, hidden behind a lazy-load script, or set as a CSS background | Make it discoverable in the HTML; add fetchpriority="high"; preload if it can’t be in the markup | Image request starts near the first resource |
| LCP image is loaded but renders late | LCP breakdown: large element render delay | Large stylesheet, synchronous script, or long main-thread tasks | Trim or inline small critical CSS; defer scripts; break up long tasks | Render delay shrinks |
| LCP is a text block, and slow | LCP element is text; check fonts | Text waiting on a web font | Use a font-display value other than auto or block; preload the font | Text appears early |
| INP fails only soon after load | Interact during load in DevTools | Long tasks while scripts load and run | Reduce or defer scripts; break up long tasks | Slow interaction disappears in the lab and then in the field |
| INP fails on one control | Reproduce the interaction; check which subpart is long | Heavy event handler | Do the minimum before the next paint; defer the rest | Interaction latency drops |
| INP is slow on mobile but fine on desktop | Test on a throttled or real mobile device | Device differences expose heavy scripts or a large DOM | Reduce scripts and DOM size | Mobile field INP improves |
| CLS appears in field data but not in the lab | Compare field and lab CLS in PageSpeed Insights | Post-load shifts: lazy content, ads, embeds, banners | Reserve space; test scrolling flows | Field CLS improves |
| Content jumps when images load | Lighthouse CLS audits; DevTools layout-shift track | Images without dimensions | Add width and height, or aspect-ratio | Shifts gone in the lab |
| Text jumps when fonts load | Disable cache; watch text on load | Fallback and web font differ in size | Use font-display: optional, or match the fallback font’s metrics | Text no longer reflows |
Fix LCP
Largest Contentful Paint is the time from the start of the page load until the largest image or text block in the viewport is drawn. Google’s key point is that a quick fix to one part of the page rarely produces a meaningful improvement. You have to look at the whole loading process. Source for this whole section: Optimize Largest Contentful Paint.
Find your LCP element, on each device
Run PageSpeed Insights or DevTools and note the LCP element. It may be a different element on mobile than on desktop, because layouts and image sizes can change. Check both.
Break LCP into four parts
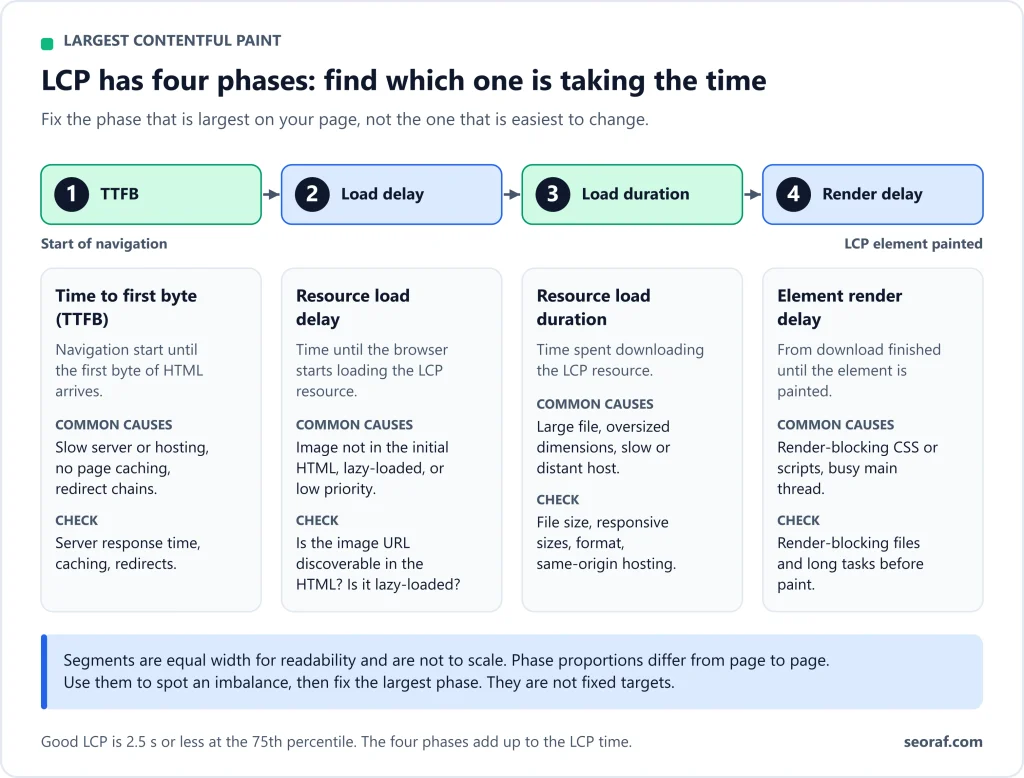
Every LCP time splits into four parts that add up to the total:
- TTFB: the time until the server’s first byte arrives.
- Resource load delay: the time before the browser starts loading the LCP resource.
- Resource load duration: how long that resource takes to download.
- Element render delay: the time between the resource finishing and the element being drawn.
Google’s rough guideline for a well-optimized page is TTFB about 40%, load delay under 10%, load duration about 40% and render delay under 10%. Treat these as proportions to spot an imbalance, not as targets. Google specifically warns against converting them to fixed times.
Hypothetical example, not measured data: suppose a page has a 4.0 s LCP, with 0.5 s of TTFB, 1.6 s of load delay, 0.8 s of load duration and 1.1 s of render delay. The large delays tell you the image is being found late and then waiting to render. Compressing the image further would not address either problem. This is why diagnosis comes first.
One more warning from Google’s guide: an optimization on one part can just shift the time to another. Shrinking an image can reduce the load duration while the render delay grows, leaving LCP unchanged.
Fix: slow server response (TTFB)
Check: TTFB in PageSpeed Insights, and the first request in the DevTools waterfall.
Likely causes: multiple redirects (for example from ads or shortened links), visitors far from the server, or content that can’t be served from a cache. A common one is unique URL parameters added for analytics, which can stop a CDN from serving cached copies even when the page is the same.
Fix: reduce redirects, use caching, and serve from a location close to visitors if your setup allows it.
Risks: page caching can serve stale or personalised content to the wrong visitor if misconfigured. Test logged-in views, carts and forms.
Verify: TTFB falls in field data, then LCP follows.
Fix: the LCP resource starts loading too late
Check: in the network waterfall, does the LCP resource start loading about when the first resource does? If it starts later, there is an opportunity.
Likely causes:
- the image is added by JavaScript;
- a lazy-loading script hides its source (often in
data-src); - the image is a CSS background;
- the browser doesn’t recognize it as important.
Fix:
- Put the image in the page’s initial HTML as an
<img>with itssrcorsrcsetpresent. - Add
fetchpriority="high"to the image you expect to be the LCP element. Don’t set it on more than one or two images, or it stops helping. - If the image must come from a stylesheet or script, preload it with a high fetch priority.
- Never lazy-load the LCP image. It always adds avoidable delay.
- Where you can, host critical resources on the same origin as your HTML, because a different origin needs an extra connection.
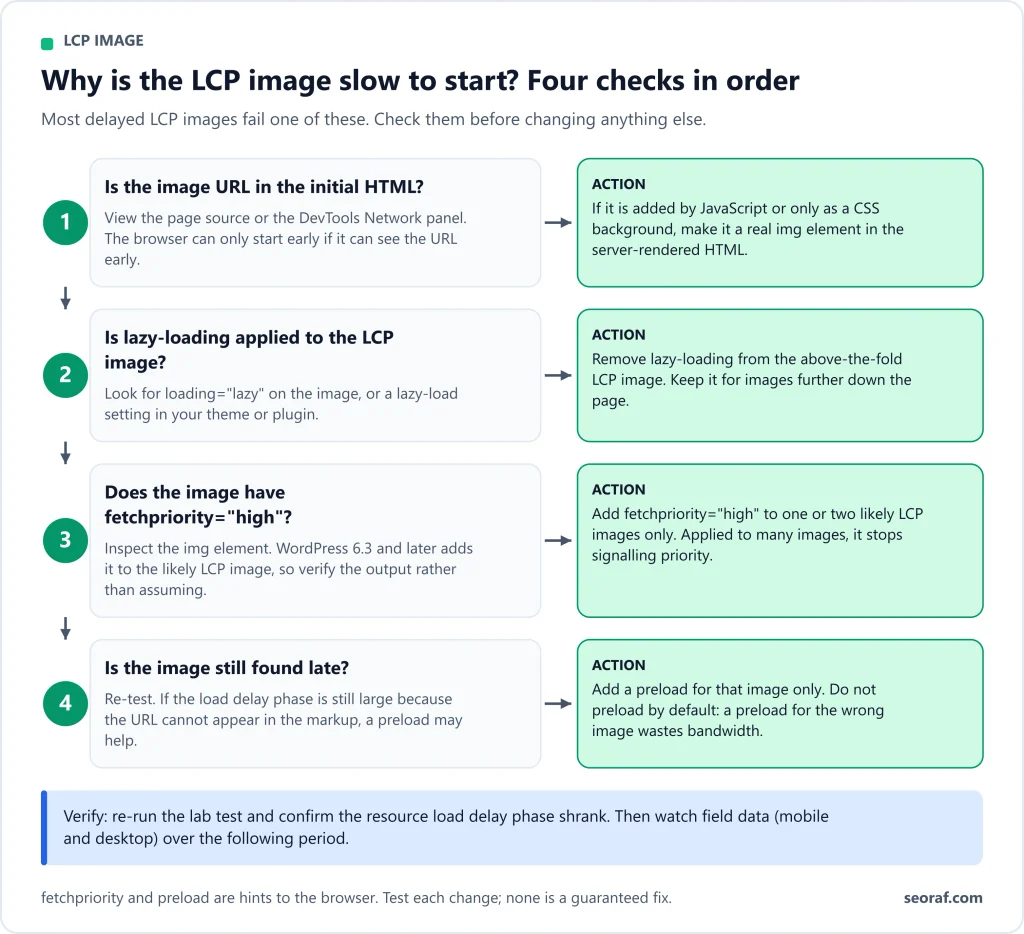
Risks: setting high priority on too many images makes the hint meaningless. Preloading an image the page doesn’t actually use wastes bandwidth.
Verify: the waterfall shows the image starting near the first resource, and the LCP load-delay slice shrinks.
Fix: LCP is delayed after the resource loads
Check: a large element render delay in the LCP breakdown.
Likely causes: a big stylesheet or a synchronous script in the <head> holding up rendering, the element not yet added to the page because it’s waiting on JavaScript, something hiding it (such as an A/B testing script), or long tasks blocking the main thread.
Fix:
- Reduce the stylesheet’s size by removing unused CSS and deferring non-critical CSS, or inline a small critical stylesheet. Inlining large stylesheets is not recommended because inlined content can’t be cached.
- Avoid synchronous scripts in the
<head>. - Break up long tasks.
Risks: removing “unused” CSS can break pages that use that CSS only on certain screens, states or pages. Check checkout pages, menus and logged-in views.
Verify: render delay shrinks and the page renders correctly on every template.
Fix: the resource itself is heavy
Reducing the size of the LCP resource is the familiar fix: serve correctly sized images, use modern formats, compress sensibly, cache and use a CDN. Google’s research shows that load duration tends not to be a significant bottleneck for most sites, so confirm that it is yours before spending time here. Use your breakdown to decide.
Risks: over-compression visibly degrades images, and an image CDN on a different domain adds a connection cost.
Fix: LCP is text waiting on a font
If the LCP element is text that needs a web font, a font-display value other than auto or block keeps text visible while the font loads. Preloading the font and reducing its size can also help.
LCP: mobile and desktop notes
Device and network capability varies widely between visitors, so check the mobile dataset separately instead of assuming it matches desktop. Responsive images matter here: make sure small screens don’t download desktop-sized files. Check whether your theme outputs srcset for the hero image.
Fix INP
Interaction to Next Paint measures how long the page takes to show a visual response after a click, tap or key press. The final value is typically the slowest interaction observed (with outliers ignored on busy pages), assessed at the 75th percentile. Hovering, scrolling and zooming don’t count, but clicks inside embedded iframes do. Sources for this section: Interaction to Next Paint, Optimize Interaction to Next Paint.
Find the slow interaction
Start with field data. Real-user monitoring can tell you which interaction was slow, whether it happened during or after load, and what type it was. PageSpeed Insights shows only the overall INP. In the lab, reproduce common user flows, and interact with the page while it is still loading, when the main thread is often busiest.
Know which part of the interaction is slow
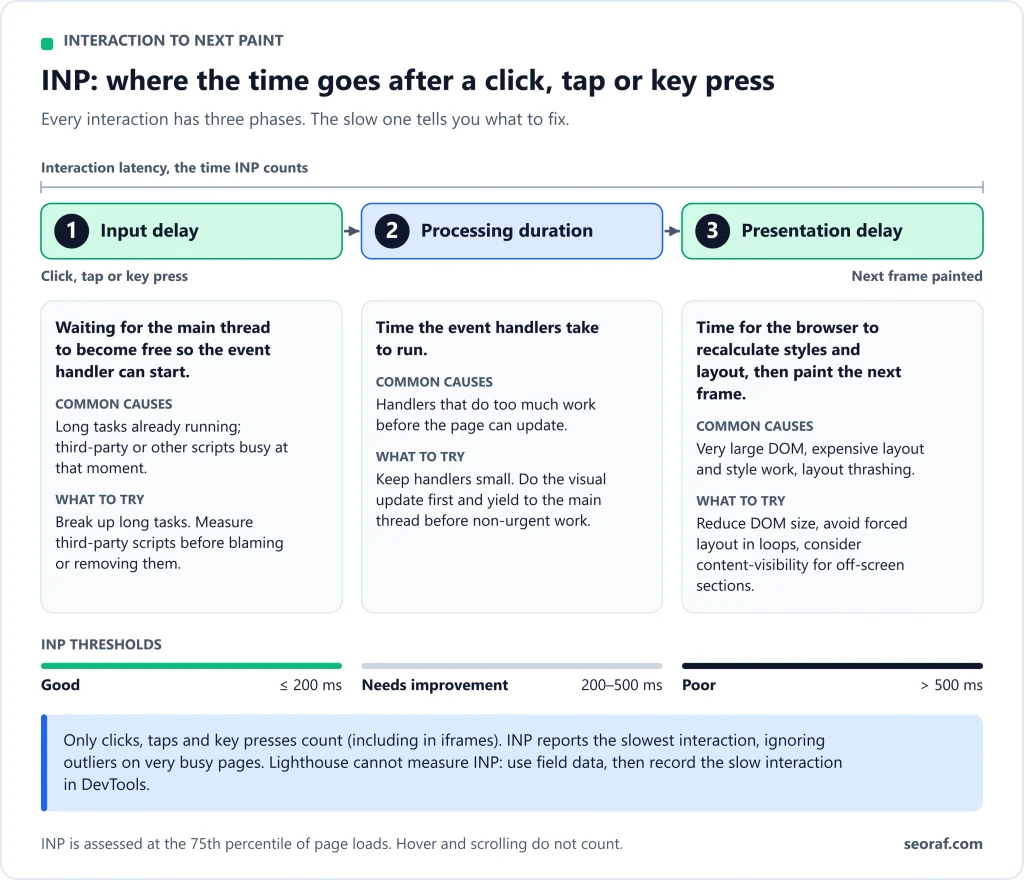
Each interaction splits into three parts:
- Input delay: time before the event handlers start, often because the main thread is busy.
- Processing duration: time for the event handlers to run.
- Presentation delay: time for the browser to draw the next frame.
Fix: input delay (the page is busy when the user acts)
Check: interact during load in DevTools and look for long tasks.
Likely cause: script download, parsing and execution create long tasks on the main thread.
Fix: load less JavaScript up front, split work into smaller tasks, and avoid running heavy scripts at the moment users are most likely to interact.
Risks: deferring a script can move its cost to the first interaction that needs it, so test the first click after the change. Removing a script can also break the feature or analytics that depend on it.
Fix: slow event handlers (processing)
Check: reproduce the interaction and look at the Performance panel for long handler work.
Fix: do the minimum needed to show the visual result before the next frame, and move everything else to a later task. Google’s guide shows a pattern for this, and it also warns about layout thrashing: changing styles and then immediately reading them forces the browser to do layout work early. Using setTimeout is one way to break up tasks, and Google calls yielding indiscriminately better than not yielding at all.
Developer-level: this fix needs changes to code, so site owners should pass the diagnosis to a developer.
Fix: presentation delay (large pages, heavy rendering)
Likely causes: a large DOM makes rendering updates more expensive, as does building a lot of HTML with JavaScript in the browser.
Fix: keep the DOM as small as practical, consider the CSS content-visibility property to lazily render off-screen content, and avoid rendering large amounts of HTML on the client in response to interactions.
Third-party scripts
Chat widgets, tag managers, analytics, heatmaps and ad scripts all add JavaScript. Don’t assume which one is the problem. Measure it: test the page with and without a suspect script and compare the interaction. If a script isn’t earning its keep, remove it. If it is, ask whether it needs to load on every page.
Illustrative example: a mobile menu feels slow on tap. The field data shows poor INP on mobile only. In DevTools, you find the tap handler runs a heavy script before the menu can paint. The fix is to open the menu first and defer the rest of the work. You confirm the change in a throttled mobile test and then in field data.
INP: mobile and desktop notes
Google’s INP guide notes there is considerable variability in the capabilities of the devices people use, so a page that responds well on your own machine can still fail for visitors on slower devices. Testing with CPU throttling in DevTools or on a real mid-range phone is an editorial suggestion for catching this.
Fix CLS
Cumulative Layout Shift measures unexpected movement of visible content. Shifts within 500 ms of a user interaction are treated as expected and don’t count, so the ones that hurt are the surprising ones. Source for this section: Optimize Cumulative Layout Shift.
Work out whether it’s load CLS or post-load CLS
Compare the CLS in PageSpeed Insights’ real-user section with the lab section. If both are bad, you probably have a shift during load, and Lighthouse will list the elements that moved. If real-user CLS is higher than the lab value, look for post-load shifts: lazy-loaded content appearing as someone scrolls, content shifting on hover, or single-page-app transitions. DevTools’ live metrics view lets you scroll and interact while watching the score.
Lighthouse shows which elements shifted, but the cause is often something inserted above them. Look for the new element.
Fix: images and video without dimensions
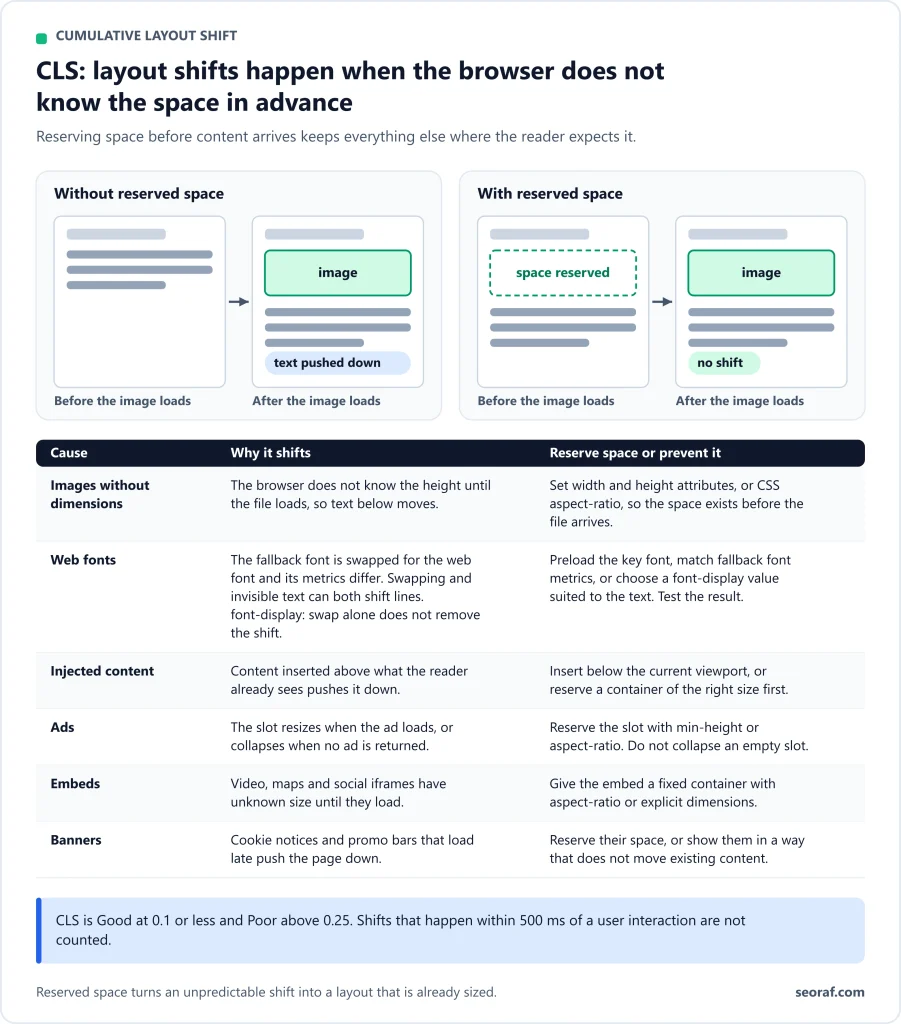
Add width and height attributes to images and videos, or reserve space with CSS aspect-ratio. Modern browsers use those attributes to work out the space before the file loads. With responsive images, each version should share the same aspect ratio, or use <picture> with dimensions on each source.
Fix: ads, embeds and injected content
- Reserve space with
min-height, oraspect-ratiofor responsive slots. - Don’t collapse the reserved space if nothing loads, because removing space can cause just as much shift as adding content.
- If you can’t reserve space, place late-loading content lower on the page, where it moves less.
- Avoid inserting new content above what people are already reading unless they asked for it. A “Load more” button is fine, because the shift follows a user action.
- For banners and cookie notices, reserve space or overlay them without pushing content.
Risk: reserving too much space leaves blank gaps. If an ad’s size varies, the smallest likely size with min-height is a compromise.
Fix: web fonts
Both flash of unstyled text (FOUT) and flash of invisible text (FOIT) can cause shifts, since even invisible text takes up room using the fallback font’s metrics. Options include:
font-display: optional, which only uses the web font if it’s ready for the first layout;- picking a fallback font close to the web font (and always specifying a fallback);
- using
size-adjust,ascent-override,descent-overrideandline-gap-overrideto match the fallback’s metrics to the web font; - preloading critical fonts.
font-display: swap alone doesn’t remove layout shift.
Fix: animations
Animate with transform rather than properties such as top and left, which trigger layout and can cause shifts.
Make pages eligible for the back/forward cache
Pages restored from the browser’s back/forward cache (bfcache) appear instantly without repeating load-time shifts. Google recommends checking whether your pages are eligible, since some sites are ineligible for a variety of reasons.
CLS: mobile and desktop notes
Layouts change at small widths, so CLS can differ by viewport. Test banners, cookie notices and ad slots at mobile widths as well as desktop.
WordPress troubleshooting
What WordPress may already be doing
Since WordPress 6.3, core adds fetchpriority="high" to the image it judges most likely to be the LCP image (using a default minimum size of 50,000 pixels) and avoids lazy-loading early images in the page. Don’t pile a second system on top of this without checking what’s already happening. Source: Image performance enhancements in WordPress 6.3.
This behavior is documented for WordPress 6.3. Check the release notes for your WordPress version to see whether it has changed.
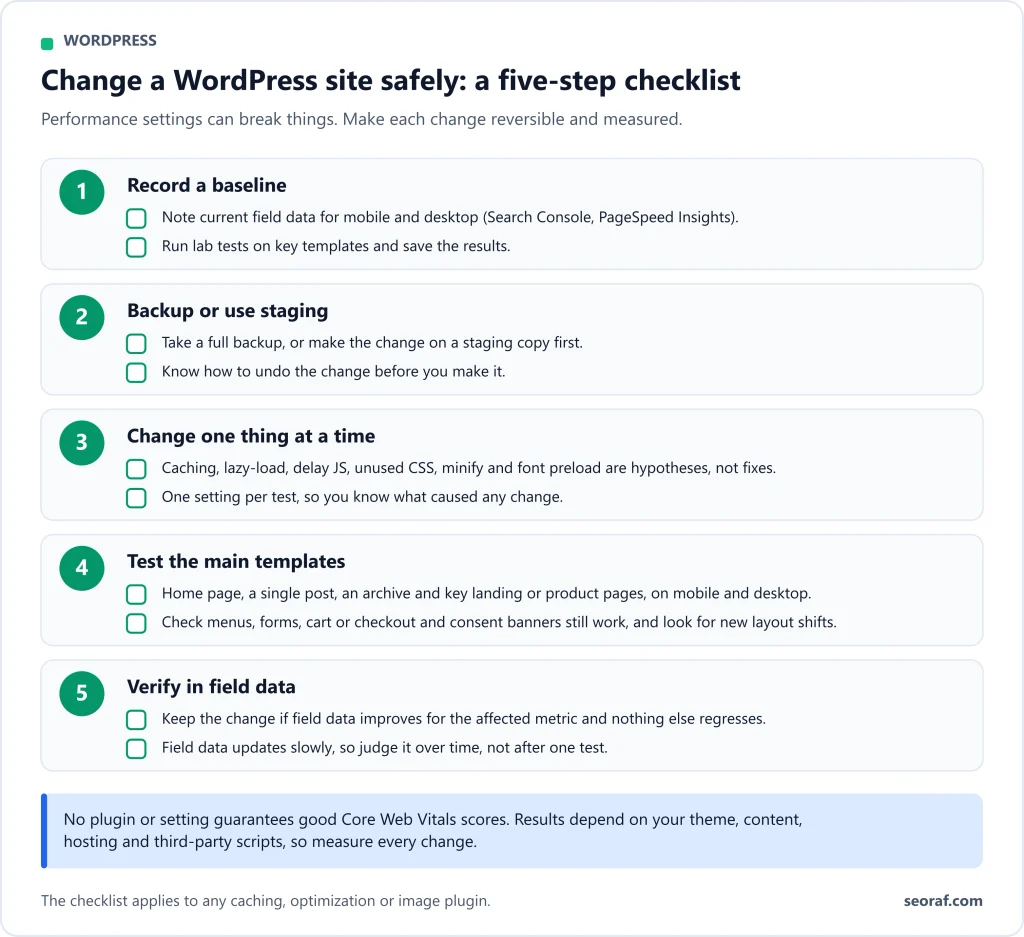
A safe change workflow
- Take a baseline: field data from PageSpeed Insights and Search Console, plus a lab run.
- Back up the site, or use a staging copy.
- Change one setting at a time.
- Retest the affected templates, not only the home page: a post, a page, an archive, and any cart or checkout.
- Check the site as a visitor and as a logged-in user.
- Roll back anything that causes visual or functional problems.
- Watch field data over the following weeks.
Don’t assume everyone has the same plugins
Caching, image and script-control plugins differ widely, and some hosts provide their own caching, so check what is already running before adding another layer. Instead of recommending a product, use this table to evaluate whichever settings you have.
| Setting you may have | What it may help | What can go wrong | How to test |
|---|---|---|---|
| Page caching | TTFB, so LCP | Stale or wrong content for logged-in users, carts and forms | Test as a visitor and as a logged-in user; check cart and checkout |
| Image lazy loading | Initial page weight | Delays the LCP image if it is lazy-loaded | View the LCP image’s HTML and confirm it isn’t lazy-loaded |
| Image conversion and compression | Resource load duration | Quality loss; broken images on some templates | Compare images visually; check responsive sizes |
| Delay or defer JavaScript | Input delay during load | Broken menus, forms, sliders; cost moves to the first interaction | Click through key flows; test INP after the change |
| Remove unused CSS / critical CSS | Render delay | Missing styles on pages not generated during setup | Visit every template type, including logged-in views |
| Minify or combine files | File size | Can break scripts | Test functionality; compare before and after in the waterfall |
| Font preloading and local font hosting | Text LCP and CLS | Preloading unused fonts wastes bandwidth | Confirm in the network panel the font is used |
Every row is a hypothesis to test, not a setting to switch on for everyone. Some sites will see little benefit from a given setting, and some will see regressions.
Gutenberg and lightweight themes
Many of these points depend on how your site is built, so check them in your own pages rather than assuming:
- Is your hero an
<img>or a CSS background? View the page source or inspect the element. An<img>in the HTML is discoverable early. A CSS background image isn’t, so it may need to be preloaded or replaced with an image element. Check how your theme’s Cover or hero block outputs images in your configuration. - Do images have dimensions? Check the rendered HTML for
widthandheighton images, including ones from patterns, widgets and page-builder-style blocks. Confirm that your theme and block settings output them. - Are embeds reserving space? Video and social embeds often don’t know their size in advance, so confirm the area is reserved before the embed loads. Check the behavior of the embed blocks you use.
- How big is your DOM? Deeply nested Group and Columns blocks, or many plugin-added wrappers, can enlarge the DOM and slow rendering. Inspect your heaviest templates in DevTools’ Elements panel and simplify the layout where you can. This is editorial advice and depends on your content.
- Fonts: a theme that uses only system fonts has no web font to swap in, so it avoids that source of shift. If you use web fonts, host them sensibly and follow the font options in the CLS section.
A lightweight theme and a lean block-based layout are a good starting point, but they don’t guarantee passing scores. Third-party scripts, ads and embeds can fail a lean site too.
Can you fix this without coding?
Often yes for LCP and CLS: configuring caching, checking the hero image, adding image dimensions and reserving space for banners are all settings or content changes. INP problems usually trace back to scripts and may need a developer, but removing unneeded plugins and scripts is a non-coding step you can try first.
For broader speed topics such as hosting and caching, see our site speed optimization guide.
Ecommerce notes
Shops tend to have more scripts, more images and more dynamic content than blogs. The diagnosis workflow is the same, but a few places are worth checking:
- Product galleries and listing grids: give all product images consistent dimensions or aspect ratios so galleries don’t shift as images load (CLS).
- Apps and extensions: every app or extension can add JavaScript. Review what is installed, measure the impact of each suspect, and remove what you don’t use (INP).
- Banners, cookie notices and carousels: reserve space or overlay them. Google publishes best-practice guides for carousels and cookie notices that are worth reviewing.
- Cart and checkout: test these flows separately, since they are dynamic and may be handled differently by your caching setup. Be cautious with changes here, and test purchases after any change.
- Theme and platform: don’t assume a specific theme or host is “optimized”. Measure yours.
For a store-specific audit, see our ecommerce SEO audit checklist.
Developer-level notes
- Collect your own field data. The
web-vitalslibrary measures all three metrics in a way that matches Google’s tools, with attribution data to show which element or interaction is responsible. Google recommends it because CrUX can’t explain causes. Note that JavaScript measurements can differ slightly from CrUX (for example for iframe content). - Rendering strategy: server-side rendering makes images discoverable in the HTML and avoids waiting for JavaScript before content appears, but it takes server time and can raise TTFB. Static generation avoids that when your architecture allows it.
- Main-thread work: yield between tasks, keep handlers short, avoid layout thrashing, and limit DOM size. Moving work off the main thread (for example into a web worker) is another option. Review Google’s guide to running JavaScript off the main thread before applying it to a specific case.
- Single-page apps: Core Web Vitals were historically measured per full page load. Chrome 151 introduced measurement APIs for “soft navigations”, and CrUX began publishing experimental soft-navigation variants of LCP, INP and CLS, with graduation from experimental planned for May 2027. Most tools still report the traditional metrics. These are recent developments, so check the SPA Core Web Vitals FAQ and the CrUX release notes for their current status.
Verify the fix and keep it fixed
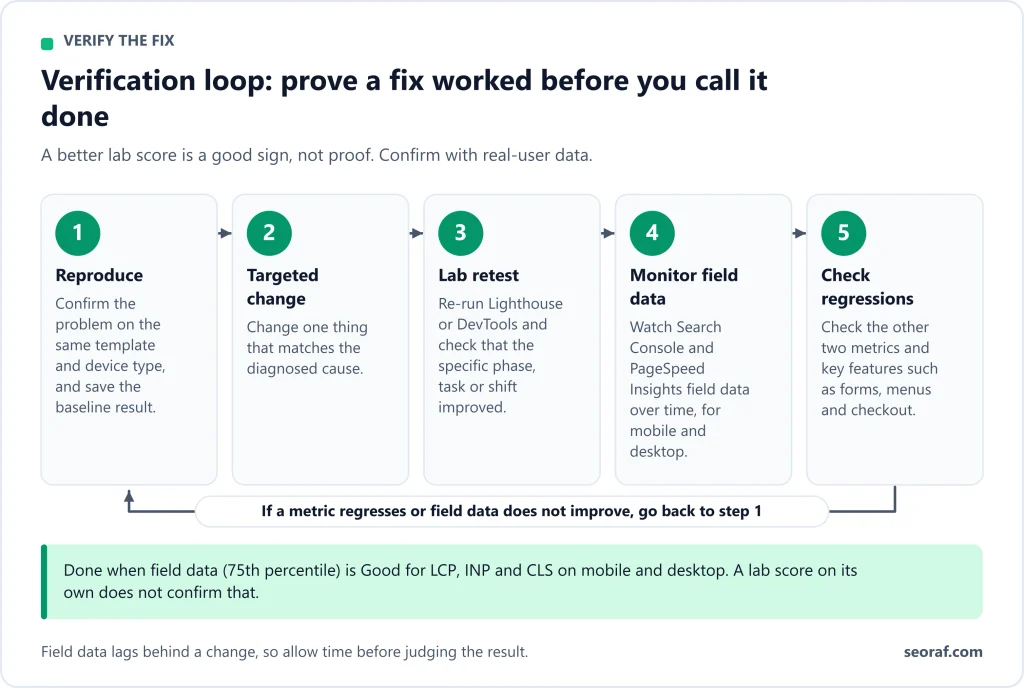
- Retest in the right order. Use the lab to confirm you’ve fixed the diagnosed cause. Then use field data to confirm that real users benefit.
- Expect a delay. CrUX field data is aggregated over a period, so improvements don’t appear immediately. For the exact reporting window and how fix validation works, see the PageSpeed Insights and Search Console documentation.
- Re-check after changes. Themes, plugins, ad tags and new scripts can bring problems back. Re-run your baseline after each significant change.
- Keep expectations realistic. A pass doesn’t promise ranking or traffic gains. If traffic has dropped, Core Web Vitals are one of many possible causes, so start with a broader diagnosis. Our Google traffic drop guide covers that, though its Core Web Vitals section is brief.
Prioritized checklist
Diagnose (everyone)
- Open Search Console’s Core Web Vitals report and note which metric and device fail.
- Check the same URL’s real-user data in PageSpeed Insights, on mobile and desktop.
- Note whether you’re seeing URL-level or origin-level data.
- Reproduce the issue in DevTools, and identify the LCP element, slow interaction or shifting element.
Fix by metric (choose by diagnosis)
- LCP: identify the slowest of the four parts, then fix that part first. Check that the LCP image isn’t lazy-loaded and is discoverable in the HTML.
- INP: find the slow interaction and which of the three parts is slow. Reduce script and DOM weight, and break up long tasks.
- CLS: decide whether it’s load or post-load. Give images and embeds reserved space, handle fonts, and reserve space for banners and ads.
WordPress and ecommerce
- Back up, change one setting at a time, and test templates and logged-in views.
- Review plugins, apps and scripts, and remove what you don’t use.
- Test carts and checkouts separately.
Verify
- Confirm the lab result, then watch field data over the following weeks.
- Re-check after theme, plugin or script changes.
Sources
- Web Vitals (web.dev)
- Interaction to Next Paint (web.dev)
- Optimize Largest Contentful Paint (web.dev)
- Optimize Interaction to Next Paint (web.dev)
- Optimize Cumulative Layout Shift (web.dev)
- How SPA architectures affect Core Web Vitals (web.dev)
- Understanding Core Web Vitals and Google Search results (Google Search Central)
- Understanding page experience in Google Search results (Google Search Central)
- Chrome UX Report release notes (Chrome for Developers)
- Image performance enhancements in WordPress 6.3 (Make WordPress Core)
- web-vitals library (GitHub)