Ultimate SEO KPI Dashboard: Your Complete Guide for 2026
This guide was updated with the latest 2026 SEO reporting practices and KPI tracking workflows, including advanced diagnostic strategies for AI-driven search environments.
Find quick answers to common questions in our FAQ section.
Quick Summary
- This guide explains what an SEO KPI dashboard is and why it matters.
- You’ll see the core SEO metrics that actually support business decisions.
- The article includes a ready-to-use KPI template, checklists, and build steps.
- It also shows how to create separate dashboard views for executives, clients, and SEO teams.
- You can use the included template and PDF resource to speed up your reporting process.
- New for 2026: Advanced sections for Affiliate, Local, and Enterprise SEO reporting.
Creating an effective SEO KPI dashboard is essential for tracking performance, demonstrating value, and making data-driven decisions. In today’s competitive digital landscape, having a comprehensive search metrics tracking interface helps you monitor progress, identify opportunities, and communicate results to stakeholders. This guide will walk you through everything you need to know about building and implementing an SEO performance tracker that delivers actionable insights and drives measurable results.
Whether you’re an SEO professional managing multiple clients, an in-house specialist reporting to executives, or a business owner trying to understand your organic performance, a well-designed SEO reporting template can transform how you track and report on your search engine optimization efforts. Let’s dive into the essential components, metrics, and strategies for creating a dashboard that actually works.
What is an SEO KPI Dashboard?
An SEO KPI dashboard is a visual interface that displays key performance indicators (KPIs) related to your search engine optimization efforts. It consolidates data from various sources into a single, easy-to-understand view, allowing you to track progress toward your SEO goals at a glance. Unlike traditional spreadsheets or manual reports, a well-designed SEO metrics dashboard provides real-time or near real-time insights that help you make informed decisions quickly.
Your SEO KPI dashboard should serve as the central hub for monitoring organic search performance, combining quantitative metrics (like traffic and rankings) with qualitative insights (like content performance and technical health). When properly configured, it becomes a strategic tool that not only tracks historical performance but also helps predict future trends and opportunities.
Expert Insight: In 2026, a dashboard isn’t just about tracking rankings; it’s about connecting search intent to revenue. If your dashboard treats a “Number 1 ranking” as the victory, you are measuring the wrong metric. The victory is the conversion that happens *after* the click. Your dashboard must visualize the gap between visibility and value.
Why SEO KPI Dashboards Matter
Investing time in creating a comprehensive SEO KPI dashboard delivers significant benefits for SEO professionals, agencies, and businesses:
- Efficiency: Automates data collection and visualization, reducing manual reporting time by up to 80%.
- Clarity: Transforms complex data into visual insights that are easy to understand for non-technical stakeholders.
- Accountability: Creates transparency around SEO performance and ROI, justifying continued investment.
- Proactive Management: Helps identify issues and opportunities early, allowing for faster response times.
- Strategic Alignment: Connects SEO activities directly to business objectives and revenue goals.
For agencies and consultants, an SEO reporting dashboard is particularly valuable for client communication. It provides a professional, data-driven way to demonstrate the value of your services, justify retainers, and build trust through transparency. For in-house teams, it helps secure executive buy-in and resources by clearly showing how SEO contributes to broader business goals.
Actionable Recommendation: When presenting to stakeholders, never show a data point without a “So What?” column in your dashboard layout. If organic traffic dropped 10%, the next cell should explain the diagnosed cause (e.g., “Seasonality dip”) and the action (e.g., “Pushing seasonal content cluster next week”).
KPI Framework: Leading vs Lagging Indicators
When building your SEO KPI dashboard, it’s crucial to understand the difference between leading and lagging indicators. This framework helps you create a more balanced view of your SEO performance:
Lagging Indicators: These are outcome metrics that measure results after activities have been completed. They tell you what has happened in the past and are essential for evaluating overall performance. Examples include:
- Organic traffic growth
- Keyword rankings
- Conversion rates from organic traffic
- Revenue from organic search
Leading Indicators: These are predictive metrics that help forecast future performance and indicate whether you’re on track to reach your goals. They provide early warning signals and help you adjust strategies before problems impact results. Examples include:
- Indexing rates of new content
- Page load speed improvements
- Internal linking implementation
- Technical SEO issues resolved
A balanced SEO KPI dashboard includes both types of indicators. While lagging metrics demonstrate final results to stakeholders, leading indicators help your team stay proactive and make adjustments before they impact final outcomes.
Key takeaway: For every lagging indicator on your dashboard, include at least one related leading indicator to create a complete picture of performance and potential future results.
The KPIs That Actually Matter
While there are hundreds of potential SEO metrics you could track, the most effective SEO KPI dashboards focus on a curated set of high-impact indicators. Here are the essential KPIs that should form the foundation of your dashboard:
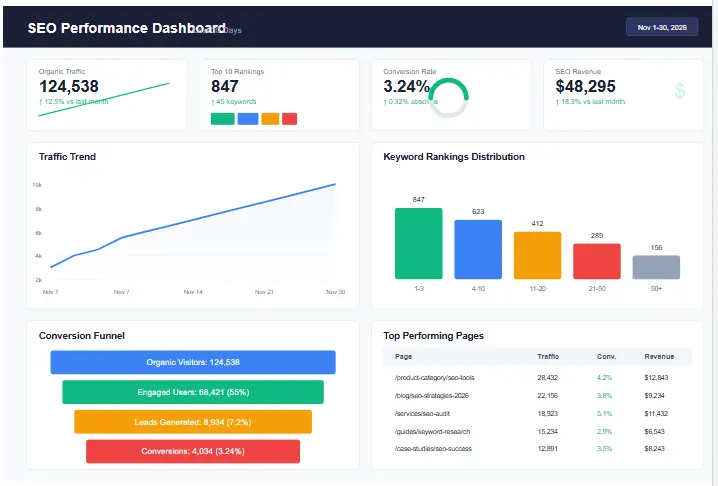
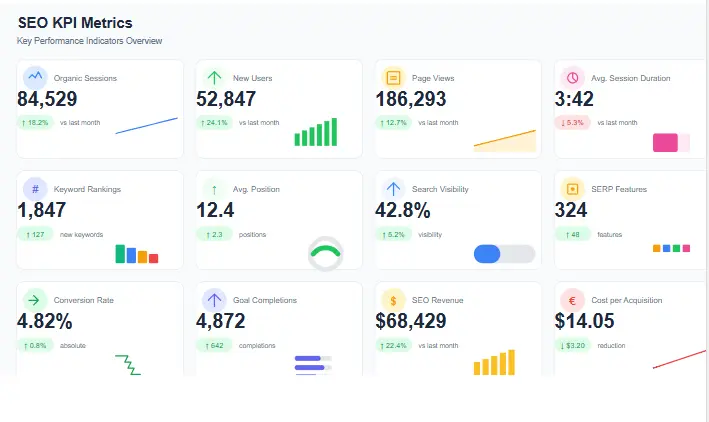
1. Organic Traffic
Organic traffic remains the cornerstone metric for most SEO KPI dashboards. However, rather than just tracking total sessions, segment this data to provide more actionable insights:
- Total organic sessions (year-over-year growth)
- New vs returning organic users
- Organic traffic by device category
- Organic traffic by landing page (top performers)
- Organic traffic by geography
For a more sophisticated SEO metrics dashboard, consider adding organic search visibility metrics that estimate your potential reach based on keyword rankings and search volume. This provides context to your traffic numbers and helps set realistic expectations.
KPI Interpretation: If organic traffic is UP but conversions are DOWN, you are likely attracting the wrong search intent (informational vs. transactional). Action: Audit keyword targets and align content with buyer-intent keywords.
2. Rankings and Visibility
Keyword rankings have evolved from simple position tracking to more sophisticated visibility metrics. Your SEO KPI dashboard should include:
- Keyword visibility score (weighted by search volume)
- Top 3, 5, and 10 keyword rankings
- Ranking distribution (how many keywords in each position band)
- Share of voice for target keywords
- Featured snippet acquisitions
Remember to segment rankings by intent (informational, commercial, navigational) to better understand how your SEO strategy is performing across different stages of the customer journey.
Advanced Insight: Track “Brand vs. Non-Brand” visibility separately. If Non-Brand visibility drops but Brand traffic stays flat, your topical authority is eroding. If Brand drops, it’s often a PR or brand awareness issue, not purely SEO.
3. Conversions and Leads
For business stakeholders, the most important section of your SEO KPI dashboard will be conversions. Connect SEO activities to business outcomes by tracking:
- Organic conversion rate
- Number of organic conversions (leads, sales, sign-ups)
- Revenue from organic traffic
- Cost per acquisition from organic search
- Micro-conversions (email sign-ups, downloads, etc.)
When implementing conversion tracking, ensure you have proper attribution models in place to avoid undervaluing SEO’s contribution to multi-touch journeys. Google Analytics offers various attribution models that can provide more accurate insights into SEO’s role in the conversion path.
4. Technical Health
Technical SEO issues can undermine all your content and link-building efforts. Your SEO KPI dashboard should monitor the technical health of your site:
- Crawlability index (pages successfully crawled vs. errors)
- Indexation rate (submitted vs. indexed pages)
- Core Web Vitals scores
- Page speed metrics (average load time) – verify via PageSpeed Insights
- Mobile usability issues
- Schema markup implementation
For a comprehensive technical health overview, consider creating an SEO audit checklist that feeds directly into your dashboard. This ensures that technical improvements are tracked and their impact on performance is measured.
5. Content Performance
Content is the engine of most SEO strategies, so your SEO KPI dashboard should provide insights into how your content is performing:
- Content engagement metrics (time on page, bounce rate)
- Top performing content by traffic and conversions
- Content gap opportunities (keywords ranking 5-20)
- Content refresh ROI (performance before and after updates)
- Topic authority score (performance across topic clusters)
For content-focused SEO strategies, consider using SEO content pruning to remove underperforming pages, and add a content velocity metric that tracks the rate at which you’re publishing new content.
6. Links and Authority
Backlinks remain a critical ranking factor, and your SEO KPI dashboard should track both the quantity and quality of your link profile:
- Total referring domains
- Domain authority/rating
- Newly acquired links
- Lost links
- Link velocity (rate of acquisition)
- Link quality distribution (by authority score)
When tracking link metrics, focus on quality over quantity. A single high-authority relevant link can be more valuable than dozens of low-quality links. Consider implementing a strategic link building approach that prioritizes relevance and authority over sheer numbers.
3 Dashboard Views for Different Audiences
One of the biggest mistakes in dashboard design is trying to create a one-size-fits-all solution. Different stakeholders need different levels of detail and focus on different metrics. Here are three distinct dashboard views that serve different audiences:
1. Executive Dashboard (One-Page View)
The executive dashboard is designed for C-suite stakeholders who need a high-level overview of SEO performance and its impact on business goals. This SEO KPI dashboard should be:
- Limited to 5-7 core metrics
- Focused on business outcomes (revenue, leads, market share)
- Visual with clear trend indicators (up/down arrows)
- Comparative (showing YoY, MoM changes)
- Include a brief commentary section explaining the “why” behind the numbers
Key metrics for the executive dashboard include organic traffic growth, organic conversion rate, organic revenue, keyword visibility, and share of voice. The goal is to provide a complete picture in under 30 seconds of viewing.
2. Client Monthly Dashboard
For agencies and consultants, the client dashboard serves as the primary communication tool about SEO performance. This SEO reporting dashboard should balance detail with clarity:
- Include 10-12 key metrics relevant to the client’s goals
- Provide month-over-month and year-over-year comparisons
- Highlight wins and achievements
- Explain fluctuations and anomalies
- Outline next month’s priorities and expected impact
For client dashboards, consider adding a “SEO Score” that combines multiple metrics into a single performance score. This makes it easy for clients to understand overall performance at a glance while still providing access to detailed metrics for those who want to dig deeper.
3. SEO Team Weekly Dashboard
The internal team dashboard is the most detailed view, designed for SEO practitioners who need granular insights to guide their work. This SEO metrics dashboard should include:
- 15-20 detailed metrics across all SEO disciplines
- Leading indicators and early warning signals
- Technical health metrics and issue alerts
- Content performance at the page level
- Competitor insights and movement (via detailed SEO competitor analysis)
- Opportunity identification (keywords ranking 5-20, content gaps, etc.)
The team dashboard should be more than just reporting—it should be an action-oriented tool that helps prioritize tasks based on potential impact. Consider adding a “priority matrix” that ranks opportunities by effort vs. expected impact.
Real SEO KPI Dashboard Case Study
To illustrate the power of a well-built SEO KPI dashboard, let’s look at a real-world scenario involving a mid-sized SaaS company struggling with stagnant growth.
The Challenge: The company had steady organic traffic but flatlining MQLs (Marketing Qualified Leads). Their existing reporting only showed keyword rankings and session counts, failing to highlight that high-traffic blog posts were attracting students (free users) rather than decision-makers (paid users).
The Dashboard Fix: We implemented a new dashboard widget called “Intent vs. Conversion Alignment.” By tagging top landing pages as “Research” vs. “Commercial,” we discovered that 70% of organic traffic was hitting “Research” content with zero conversion optimization.
The Result: 1. Immediate Action: We added exit-intent popups and anchored CTAs to the top 10 “Research” articles. 2. Mid-term Strategy: We restructured the internal linking strategy to push “Research” traffic toward “Comparison” pages. 3. Outcome: Within 90 days, organic MQLs increased by 35% without increasing traffic volume, simply by optimizing the flow of existing traffic identified by the dashboard.
Expert Insight: Don’t just build a dashboard to report on what happened. Build it to reveal what is *broken*. The gap between high traffic and low conversion is often where the biggest ROI lies.
How to Diagnose SEO Problems Using KPI Dashboards
A dashboard is useless if you don’t know how to read the tea leaves when numbers dip. Here is a decision-making framework for diagnosing issues directly from your dashboard data:
Scenario A: Sudden Drop in Organic Traffic (Rankings Stable)
- Diagnostics: Check your “Impressions” in GSC. If Impressions are stable but Clicks dropped, your titles or meta descriptions are losing appeal (CTR drop). If Impressions dropped, check if you lost rankings or if search volume seasonality dipped.
- Action: Run a programmatic SEO audit of Title Tags to improve CTR.
Scenario B: Rankings Increase, Traffic Decreases
- Diagnostics: This is a classic “Zero-Click Search” phenomenon. Google is answering the query directly in the SERP (Featured Snippets, People Also Ask).
- Action: Optimize for Featured Snippets to “win” the zero-click box, or pivot content focus to long-tail, high-intent keywords that drive traffic.
Scenario C: High Traffic, High Bounce Rate, Zero Conversions
- Diagnostics: Mismatched Search Intent. Users are searching for “X” but your page is about “Y”.
- Action: Review the Search Intent of your top keywords. Rewrite content to answer the specific query users are asking, or add a clear “Did you mean…?” navigation structure.
Framework: Always follow the Traffic -> Technical -> Intent -> Conversion logic tree. Never start with “fixing keywords” until you have ruled out technical indexation issues.
SEO KPI Dashboard for Affiliate Websites
Affiliate SEO is a different beast. You don’t care about “leads” in the CRM; you care about clicks to merchants and EPC (Earnings Per Click). Your dashboard must reflect this reality.
Critical Affiliate KPIs
- Click-Through Rate to Merchant (CTR): Are people clicking your affiliate links?
- Earnings Per 100 Clicks (EPC): A high traffic volume with low EPC means you are attracting the wrong audience or promoting low-quality offers.
- Amazon/Network Conversion Rate: If you send 1000 clicks to Amazon and they buy nothing, the problem is your product selection or review honesty.
- Table of Contents (TOC) Clicks: Tracking how many users use your jump links indicates engagement.
- Reverse Image Search Losses: Monitor if sites are scraping your images (and potentially stealing affiliate commissions).
Expert Insight
For affiliate sites, track “Coupon/Deal Click Velocity.” If your “Black Friday Deals” page traffic spikes 300% in November but affiliate clicks only go up 50%, your offer is outdated or buried too deep in the content. Use Core Web Vitals as a proxy for user trust—slow sites kill affiliate conversions.
SEO KPI Dashboard for Local Businesses
Local SEO dashboards must bridge the gap between Google Business Profile (GBP) metrics and real-world foot traffic.
Critical Local KPIs
- GBP “Call” Button Clicks: This is often a higher value metric than website visits for service businesses.
- “Directions” Clicks: The ultimate conversion for brick-and-mortar stores.
- Local Pack Ranking Density: Don’t just track position #1. Track how often you appear in the Local Pack for your 5 core service terms.
- Review Velocity & Sentiment: A drop in reviews is a leading indicator of a future ranking drop.
- Map Query Categories: Are you appearing for “near me” searches or specific “service + city” searches?
Actionable Recommendation: Create a “GBP Health Score” in your dashboard that combines Rating, Review Count, and Response Time. If your Response Time exceeds 24 hours, flag the score as “Critical.”
Advanced KPI Monitoring for Enterprise SEO
Enterprise SEO deals with scale, complexity, and politics. Your dashboard must handle millions of URLs and federated teams.
Enterprise-Specific KPIs
- Crawl Budget Utilization: Are you wasting Google’s time on parameters, faceted nav, or duplicates?
- Segment-Level ROI: Track organic revenue by product line or business unit to allocate internal budget.
- Orphaned Page Rate: The percentage of pages getting zero internal links. In large sites, this metric often balloons unnoticed.
- Log File Analysis Ratio: Compare what Google crawls vs. what actually earns traffic. High crawl/low traffic = wasted server resources.
- Self-Referencing Canonicals: A technical hygiene metric that prevents index bloat in large faceted sites.
Advanced Strategy: Implement Log File Analysis into your dashboard. If the “Money Pages” are being crawled less frequently than the “Blog Archives,” you have an internal linking architecture problem that needs immediate technical remediation.
Free SEO KPI Dashboard Template
Get Your Free SEO KPI Dashboard Template (Limited Time)
Download our comprehensive Excel template with pre-built formulas, charts, and automated tracking to start monitoring your SEO performance today.
Open the download panel
After submitting, you’ll receive the download link: https://www.seoraf.com/wp-content/uploads/2026/02/SEO-KPI-Dashboard.pdf
Need the KPI tracking checklist instead?
After submitting, you’ll receive the download link: https://www.seoraf.com/wp-content/uploads/2026/02/SEO-KPI-Dashboard.pdf
Want the dashboard setup guide?
After submitting, you’ll receive the download link: https://www.seoraf.com/wp-content/uploads/2026/02/SEO-KPI-Dashboard.pdf
Below is a ready-to-use SEO KPI dashboard template that you can copy and paste into Google Sheets, Excel, or your preferred dashboard tool. This template includes all the essential metrics we’ve discussed, with clear definitions and notes for implementation.
| Metric | Definition | Data Source | Calculation/Notes |
|---|---|---|---|
| Organic Sessions | Total visits from search engines | Google Analytics 4 | Session default channel group = Organic Search |
| Organic Sessions Growth | Percentage change vs. previous period | Google Analytics 4 | (Current Period – Previous Period) / Previous Period |
| Organic Conversion Rate | Percentage of organic sessions that convert | Google Analytics 4 | Conversions / Sessions (for Organic Search channel) |
| Organic Conversions | Total number of conversions from organic traffic | Google Analytics 4 | Count of conversion events from Organic Search channel |
| Organic Revenue | Total revenue generated from organic traffic | Google Analytics 4 | E-commerce revenue from Organic Search channel |
| Keyword Visibility | Estimated organic search visibility based on rankings | Rank tracking tool | Weighted by search volume and position |
| Top 3 Rankings | Number of keywords ranking in positions 1-3 | Rank tracking tool | Count of keywords with position 1-3 |
| Top 10 Rankings | Number of keywords ranking in positions 1-10 | Rank tracking tool | Count of keywords with position 1-10 |
| Featured Snippets | Number of keywords triggering featured snippets | Rank tracking tool | Count of keywords with featured snippet |
| Page Load Speed | Average time for pages to load | Google Search Console | Core Web Vitals – Loading experience |
| Mobile Usability | Percentage of pages with no mobile usability issues | Google Search Console | (Total pages – pages with errors) / Total pages |
| Indexed Pages | Number of pages indexed by Google | Google Search Console | Count of indexed pages from Coverage report |
| Referring Domains | Number of unique domains linking to your site | Backlink analysis tool | Count of unique referring domains |
| Domain Authority | Score predicting ranking potential | Moz/Ahrefs/SEMrush | Third-party metric (use same tool consistently) |
| New Links | Number of new backlinks acquired | Backlink analysis tool | Count of new referring domains in period |
| Lost Links | Number of backlinks lost | Backlink analysis tool | Count of lost referring domains in period |
| Content Engagement | Average engagement time on content pages | Google Analytics 4 | Average engagement time for content pages |
| Top Performing Content | Content pages driving most organic traffic | Google Analytics 4 | Top 10 pages by organic sessions |
Step-by-Step Build Guide
Now that you understand the components of an effective SEO KPI dashboard, let’s walk through the process of building one from scratch:
Step 1: Define Your Objectives and Audience
Before you begin building your SEO KPI dashboard, clearly define:
- Who will be using this dashboard (executives, clients, team members)?
- What decisions will they make based on this data?
- What are the key business objectives SEO supports?
- What reporting frequency is needed (daily, weekly, monthly)?
These answers will determine which metrics to include, how to visualize them, and how often to update the data.
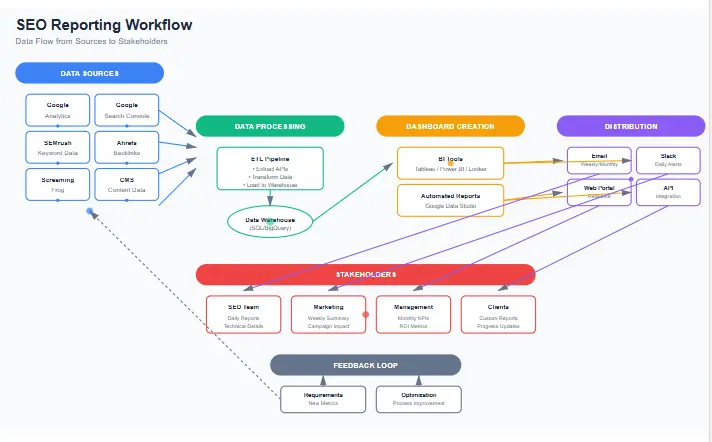
Step 2: Connect Your Data Sources
Your SEO KPI dashboard will need to pull data from multiple sources. Common integrations include:
- Google Analytics 4: For traffic, engagement, and conversion data
- Google Search Console: For performance, indexing, and technical health
- Rank Tracking Tools: For keyword visibility and ranking data
- Backlink Analysis Tools: For link metrics and authority scores
- CMS/CRM: For content and lead data
When setting up these connections, ensure you’re using consistent date ranges and segments across all data sources to maintain data integrity.
Step 3: Configure Goals and Events
To accurately measure conversions and ROI, properly configure goals and events in your analytics platform:
- Set up conversion goals that align with business objectives
- Implement enhanced ecommerce tracking if applicable
- Create custom events for micro-conversions
- Set up value attribution for each conversion type
For detailed guidance on goal setup, Google’s documentation provides comprehensive instructions for different types of conversions.
Step 4: Create Segments and Filters
To make your SEO KPI dashboard more insightful, create segments that allow for deeper analysis:
- Organic traffic segment (excluding paid search)
- Mobile vs. desktop segments
- New vs. returning user segments
- Content group segments (blog, product, service pages)
- Intent-based segments (informational, commercial)
These segments will help you identify performance differences across user types and behaviors, leading to more targeted optimization strategies.
Step 5: Design Your Dashboard Layout
Organize your dashboard with a logical flow that tells a story:
- Start with high-level outcomes (traffic, conversions, revenue)
- Move to contributing factors (rankings, technical health)
- Include leading indicators and opportunity metrics
- Add comparative data (previous periods, benchmarks)
- Finish with actionable insights and next steps
Remember to use visual hierarchy to guide the viewer’s attention to the most important metrics first.
Step 6: Set Up Alerts and Automations
Make your SEO KPI dashboard proactive by setting up alerts for significant changes:
- Traffic anomalies (sudden drops or spikes)
- Ranking changes for critical keywords
- Technical issues detected
- Conversion rate fluctuations
- New competitor movements
These alerts help you identify and address issues before they significantly impact performance.
Template + Checklist Sections
To help you implement and maintain your SEO KPI dashboard, we’ve created these checklists for different aspects of the reporting process:
Weekly SEO Check-in Checklist
Use this checklist for your weekly team reviews to ensure you’re staying on track:
- □ Review organic traffic vs. previous week and same week last year
- □ Check for any ranking changes for top 10 keywords
- □ Analyze landing page performance (top 5 gainers and losers)
- □ Review technical health alerts and resolve critical issues
- □ Check for new crawl errors in Search Console
- □ Monitor backlink acquisition and identify spammy links
- □ Review content performance for recently published pages
- □ Identify quick-win optimization opportunities
- □ Document key insights and action items for the week
Monthly SEO Report Checklist
For your monthly client or executive reports, follow this comprehensive checklist:
- □ Compare current month performance to previous month and same month last year
- □ Analyze traffic trends and identify seasonality patterns
- □ Review keyword visibility changes for target keyword groups
- □ Evaluate conversion performance and ROI from organic traffic
- □ Assess content performance by topic clusters
- □ Review backlink acquisition quality and relevance
- □ Analyze competitor movements and strategy changes
- □ Document completed activities and their impact
- □ Identify insights and opportunities for next month
- □ Set clear priorities and expected outcomes for next month
Dashboard QA Checklist
Ensure your SEO KPI dashboard is accurate and reliable with this quality assurance checklist:
- □ Verify all data connections are active and pulling recent data
- □ Cross-check key metrics against source platforms
- □ Validate calculations and formulas
- □ Ensure date ranges are consistent across all widgets
- □ Check that segments and filters are applied correctly
- □ Test interactive elements (filters, date selectors)
- □ Verify that alerts are triggering properly
- □ Confirm dashboard loads within acceptable time limits
- □ Test dashboard on different devices and browsers
- □ Document any known limitations or data discrepancies
Common Mistakes and Fixes
Even experienced SEO professionals can fall into these common dashboard traps. Here’s how to identify and fix them:
Mistake 1: Tracking Too Many Metrics
Problem: Including dozens of metrics creates noise and makes it difficult to identify what’s truly important.
Fix: Focus on 5-7 primary metrics per dashboard view, with additional secondary metrics available through drill-downs. For each metric, ask: “Will this metric drive a specific action or decision?” If not, consider removing it.
Mistake 2: Not Segmenting Data
Problem: Looking at aggregated data only can hide important insights and lead to incorrect conclusions.
Fix: Always include segmentation options in your SEO KPI dashboard. At minimum, segment by device type and traffic source. For more advanced insights, segment by user intent, content type, or customer journey stage.
Mistake 3: Ignoring Seasonality
Problem: Comparing performance without accounting for seasonal variations can make results look better or worse than they actually are.
Fix: Include year-over-year comparisons alongside month-over-month. Consider creating a seasonality index for your business to adjust expectations during peak and off-peak periods.
Mistake 4: Not Connecting SEO to Business Outcomes
Problem: Reporting only on SEO metrics like rankings and traffic without connecting them to business outcomes like leads and revenue.
Fix: Ensure your SEO KPI dashboard includes conversion and revenue metrics. Create a direct line of sight between SEO activities and business results. If your current tracking doesn’t support this, implement enhanced conversion tracking to close the gap.
Mistake 5: Setting It and Forgetting It
Problem: Creating a dashboard but not regularly reviewing, updating, or maintaining it.
Fix: Schedule regular dashboard reviews (quarterly for metrics, monthly for data sources). Assign ownership of different sections to team members. Create a maintenance log to track changes and updates.
Mistake 6: Not Accounting for Algorithm Updates
Problem: Failing to note when algorithm updates occur, making it difficult to explain performance fluctuations.
Fix: Include an annotation feature in your SEO KPI dashboard to mark algorithm updates and other significant events. This provides context when analyzing performance changes.
Conclusion
A well-designed SEO KPI dashboard is more than just a reporting tool—it’s a strategic asset that guides decision-making, demonstrates value, and drives continuous improvement. By focusing on the metrics that matter to your specific business and audience, you can create a dashboard that not only tracks performance but also inspires action.
Remember that the most effective SEO metrics dashboards evolve over time. Start with the essential metrics we’ve outlined, then refine and expand based on feedback and changing business needs. The goal isn’t to create the most comprehensive dashboard, but rather the most useful one for your specific situation.
As you implement your SEO KPI dashboard, keep in mind that the real value comes from the insights and actions it generates, not just the data it displays. Regularly review your dashboard with your team to identify trends, opportunities, and challenges, then use those insights to refine your SEO strategy.
For additional guidance on SEO best practices, Google Search Central and Google’s SEO Starter Guide offer valuable insights into the fundamentals of search optimization that complement your dashboard tracking efforts.
Frequently Asked Questions
Reviewed by: Senior Technical SEO Consultant